
Opera holds every reservation, rate, market segment and transaction your properties produce — spread across dozens of tables and hundreds of columns, in a structure built to run a hotel rather than to answer a question. Now add a second property in another country: a different currency, a different language, different legal requirements and its own way of coding market segments. “How did the group do last month?” becomes a week of spreadsheet work, and the answer still depends on who built the spreadsheet.
Corporate Solution removes that week.
We extract the full history from Opera Cloud and Opera 5 across every property, then model it into one consistent set of dimensions and measures. What you receive is not a copy of Opera’s tables. It is a data set an analyst can actually work with — and a finished application sitting on top of it.
This is the part that normally takes months. It is done before you see a report.
Corporate Solution is an Enterprise Edition module, built for groups running multiple properties.
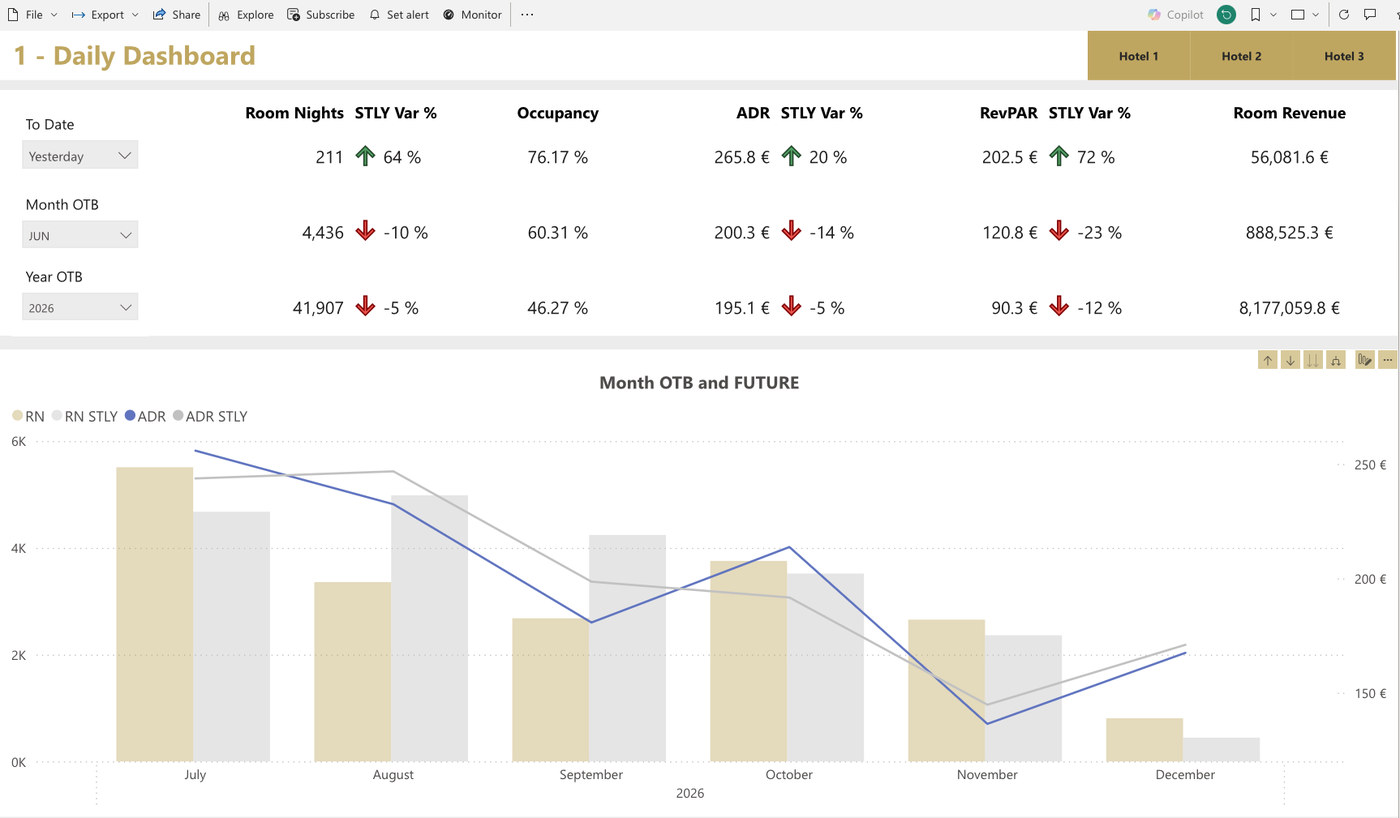
Room nights, occupancy, ADR, RevPAR and revenue for yesterday, month on the books and year on the books, each against the same time last year.
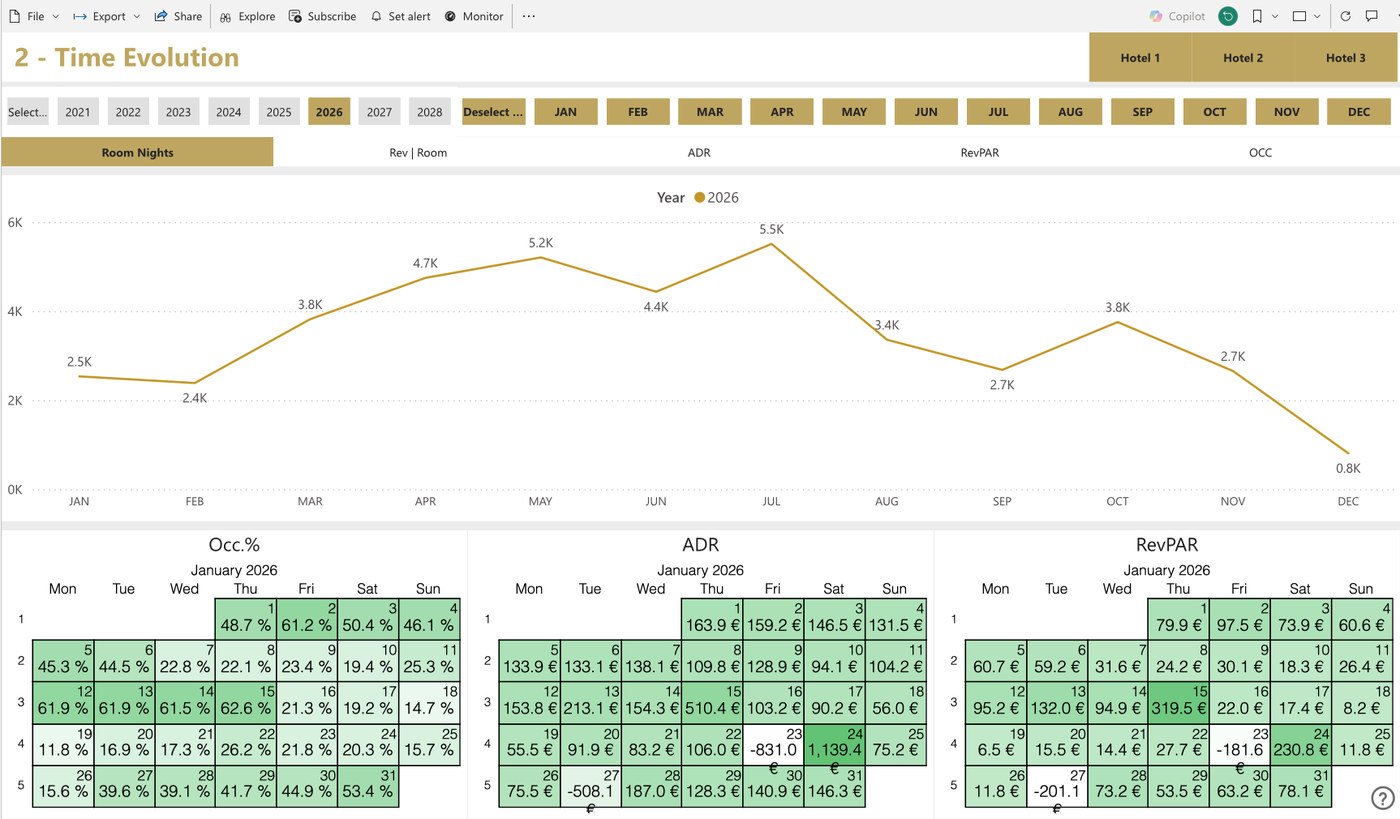
Room nights, ADR, RevPAR and occupancy over time, with day-of-week heat maps so weekly patterns are visible at a glance.
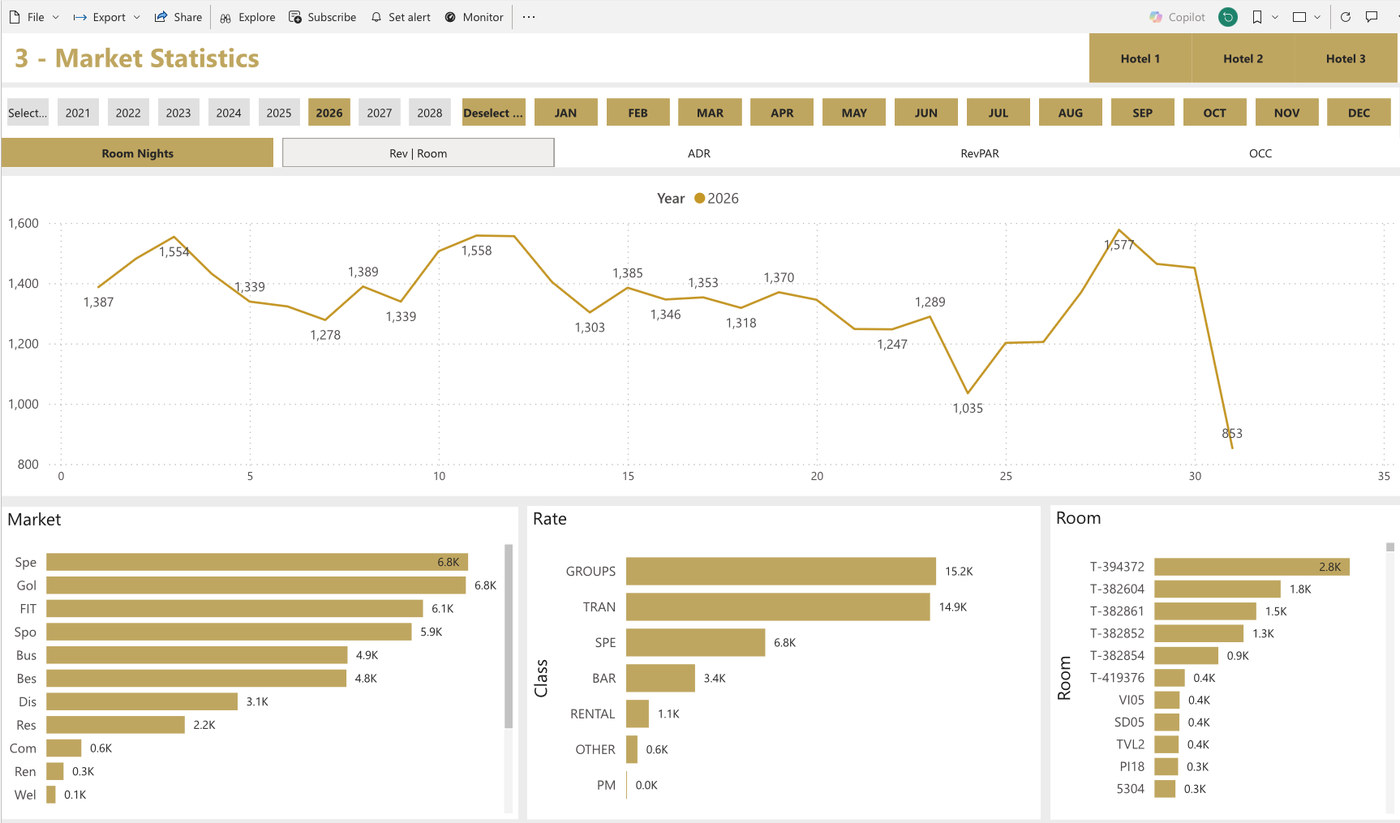
The same measures broken down by market, rate class and room class, to show where the business is actually coming from.
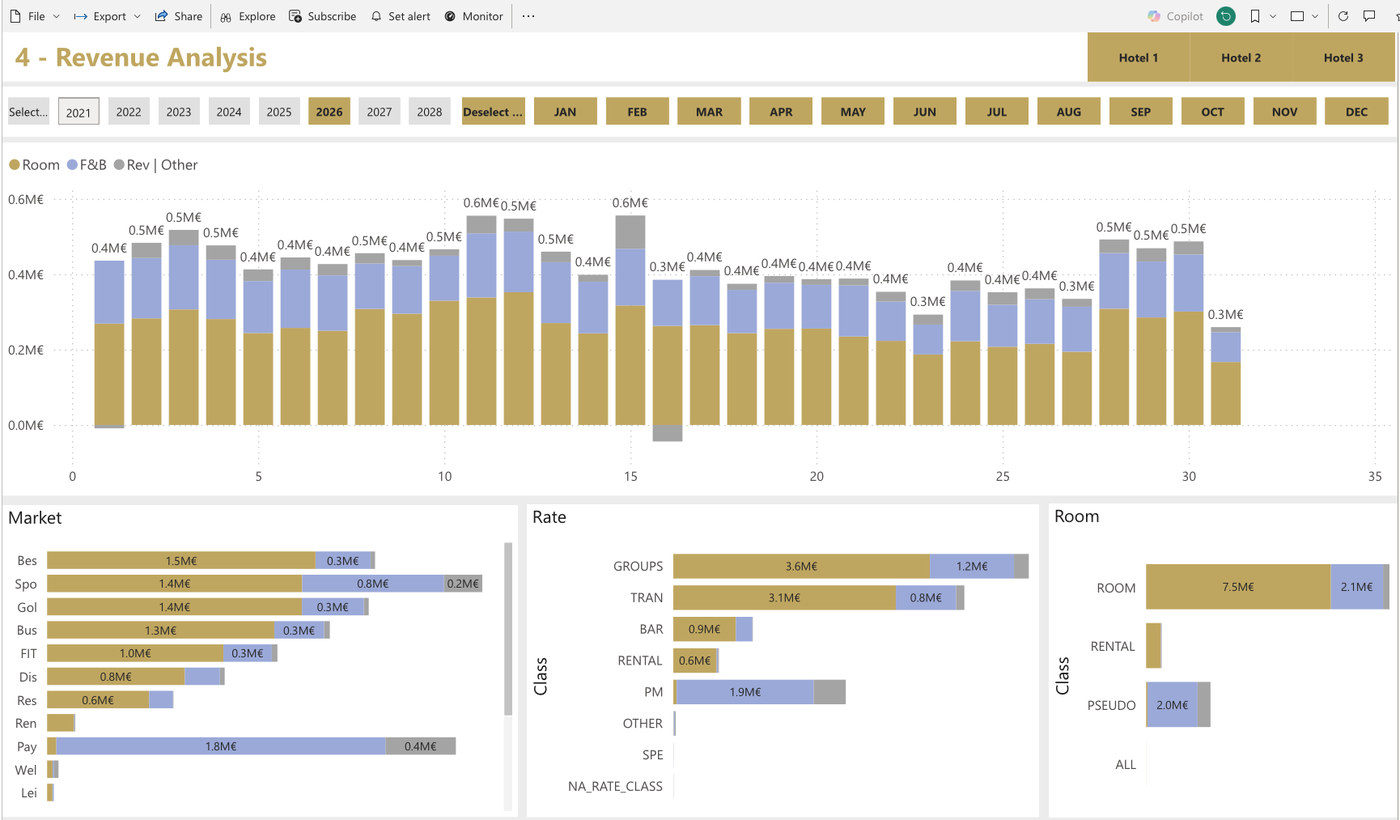
Room, food and beverage and other revenue side by side, split by market, rate class and room class.
What changed between any two dates: room nights and revenue picked up, by stay date, against last year.
Forecast against on the books at daily level, with the gap in room nights, revenue and ADR flagged where it matters.
Choose your own dimensions and measures and compare year against year. A pivot table, without exporting anything.
Production by company, group, tour operator, agent and direct profile, with revenue, room nights and ADR, and by country.
The profile records behind that production, filtered by country, business title and type.
Transactions by nationality, market and transaction code, net and gross, with payment methods including cash.
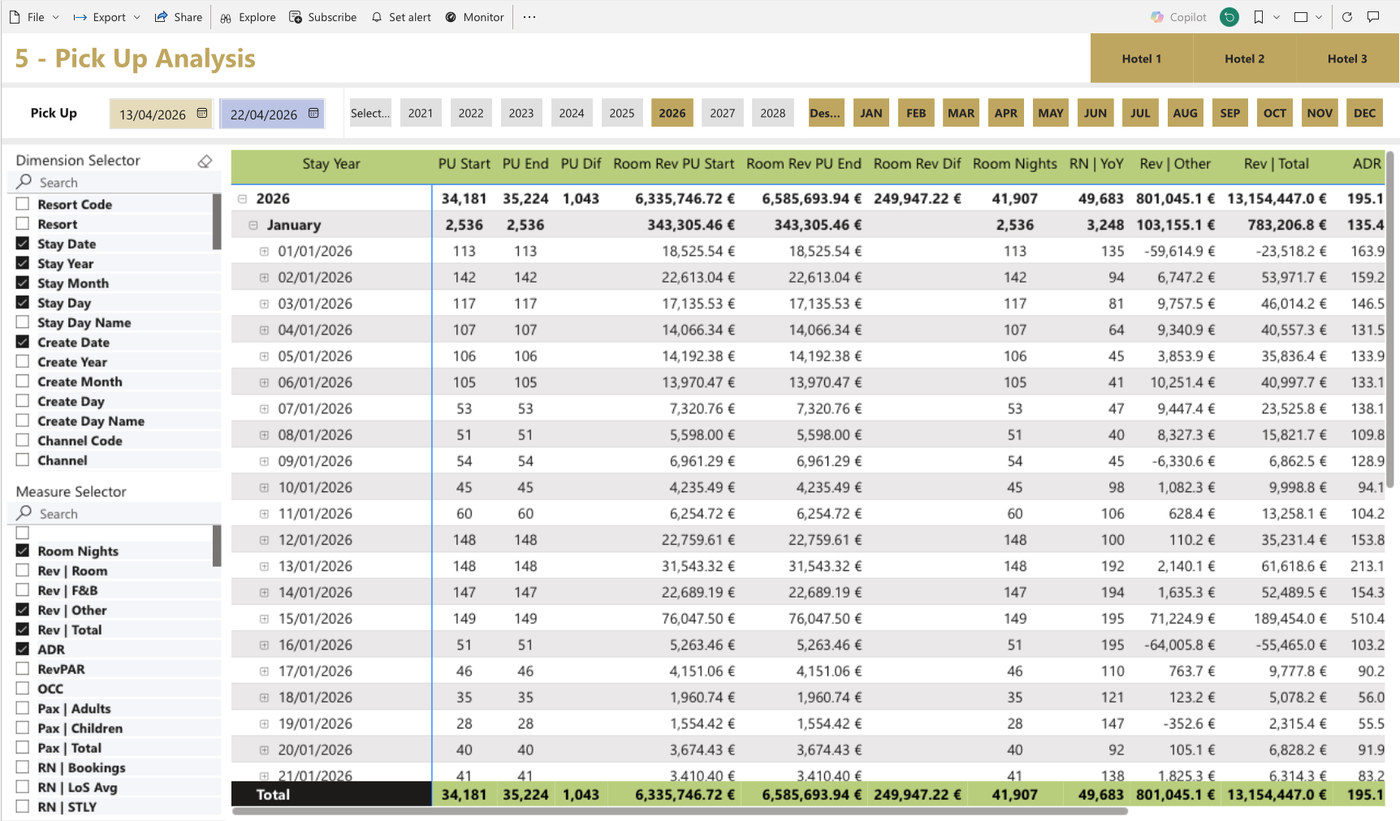
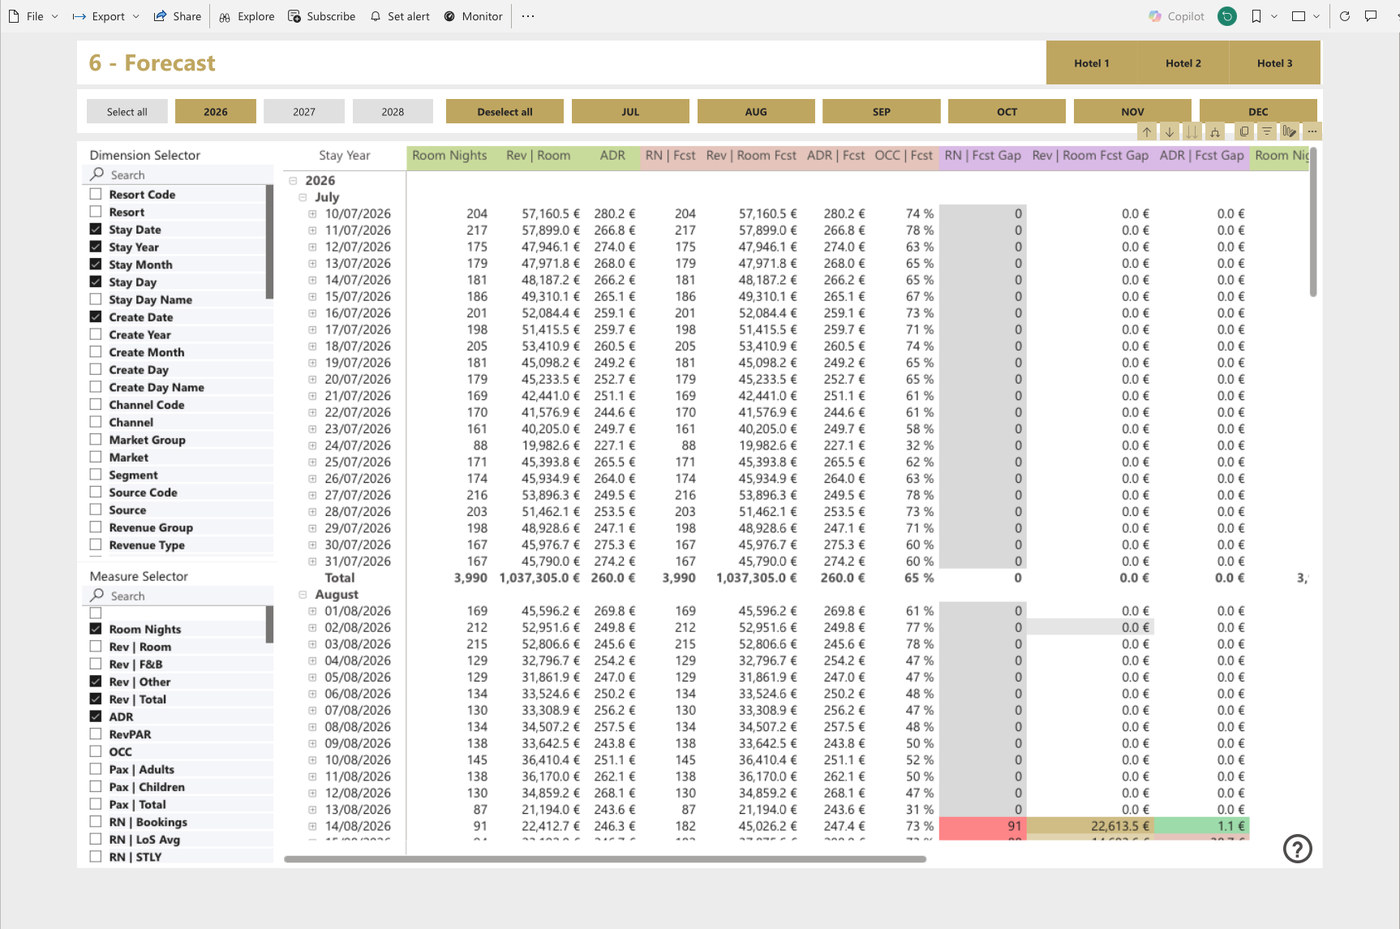
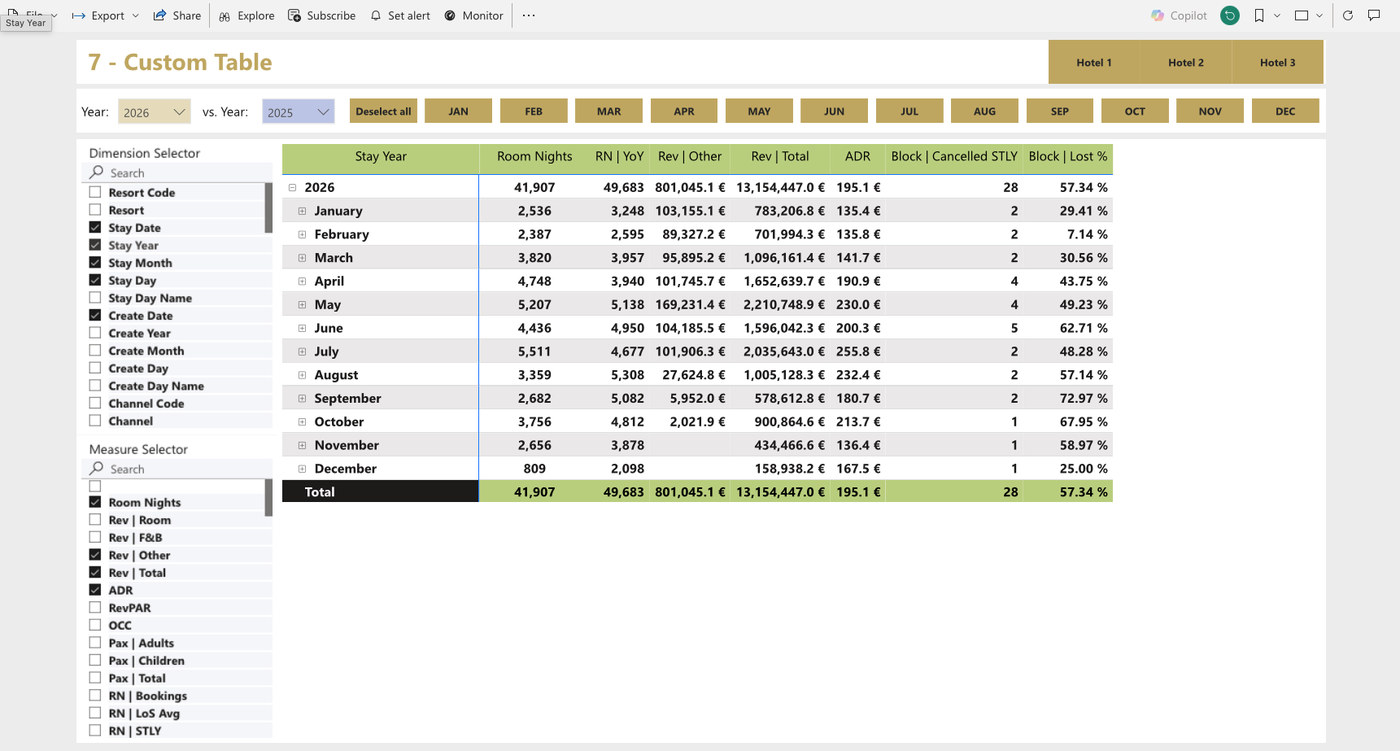
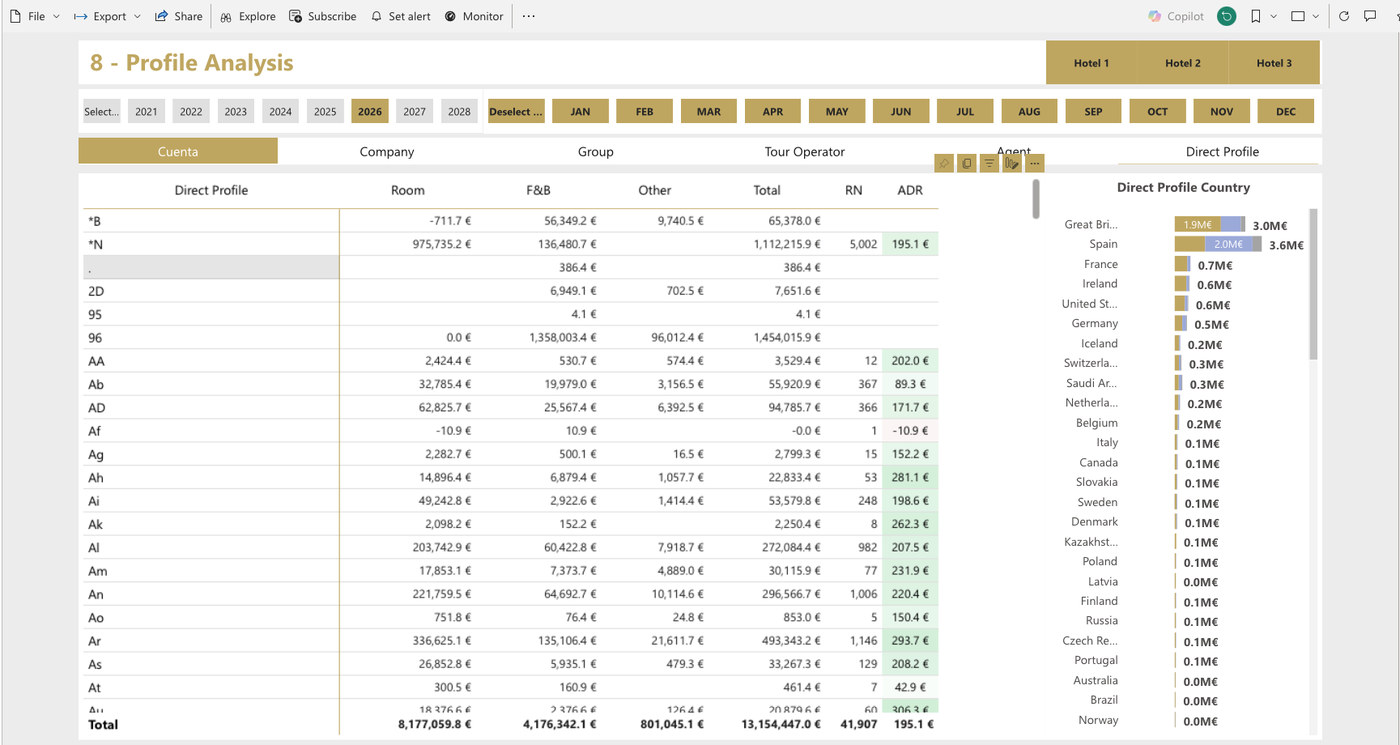
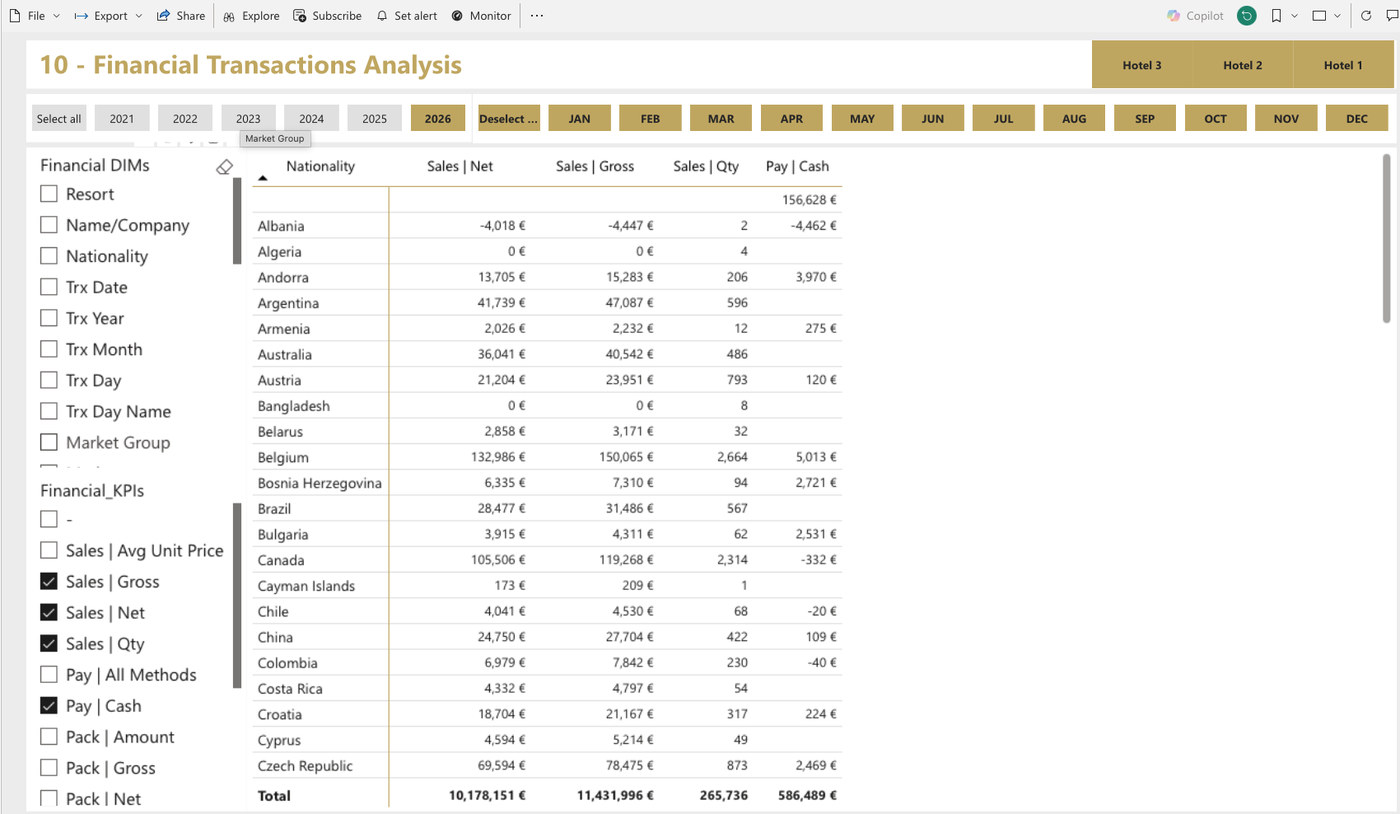
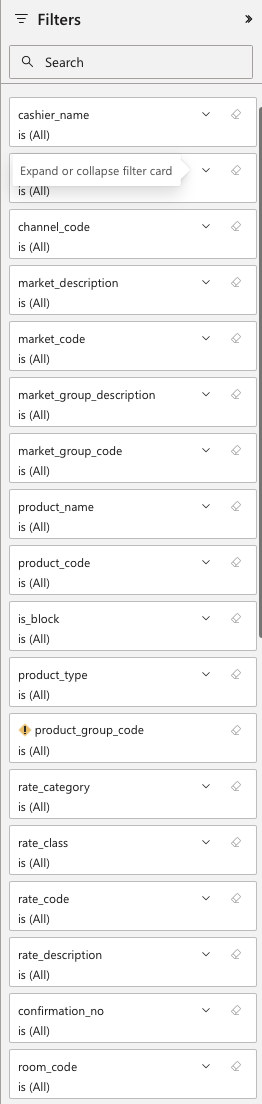
The reports are not fixed. Any of them can carry additional filters, and the Custom Table page lets anyone build their own view by picking dimensions and measures from the full list — then comparing one year against another without exporting anything.
Because the fields come from the cleaned model rather than from Opera directly, a filter means the same thing in every property in the group.
The delivered application answers what most corporate offices ask. What makes it worth more than a reporting pack is what sits underneath it: a clean, modelled, documented data set that belongs to you.
Your own analysts can add measures, build new pages, or point a different tool at the same model entirely. Teams that want to go further do. Teams that want reports that simply work leave it alone.
The cleaned data set belongs to you. It sits in your own environment, under your own licences, and it stays there whatever happens to our relationship.
There is no recurring fee holding the reports hostage. You are not tied to us in order to keep using what we built for you.
Your analysts can add measures, build new pages and reports, or point an entirely different tool at the same model. The modelling work is done and documented.
We can train your team, build alongside them, or step back completely. That is your decision to make later, not a condition of starting.
Most business intelligence consultancies can build a dashboard. Most hospitality consultancies know Opera. Very few teams do both — and that gap is usually where these projects fail: a data specialist who has never seen a night audit, or a systems consultant who has never modelled a data set.
Our consultants work on both sides. Opera Cloud, Opera 5, Simphony and OHIP on the hospitality side. Power BI, Qlik Sense, Azure and Microsoft Fabric on the data side. The person mapping your rate codes knows what a rate code is for.
We will walk you through them on a sample group, or connect a demonstration to your own data. Whichever tells you more.